
1. The chart at a glance
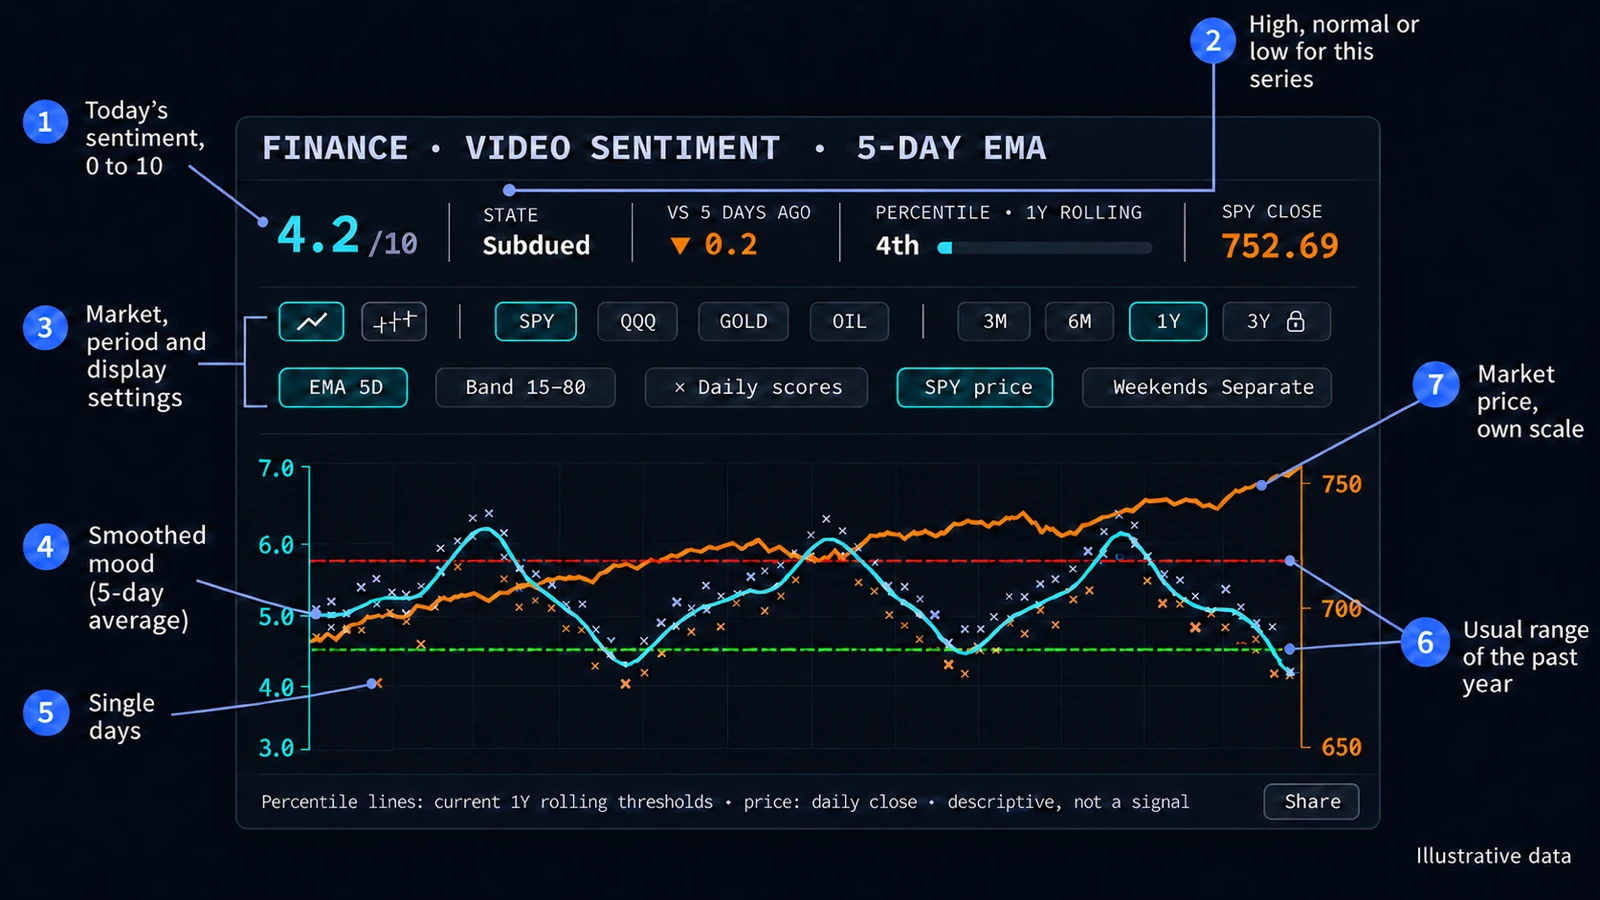
The chart sets two things side by side: the mood of finance video commentary and the price of a market. Every video gets a sentiment score from 0 to 10, from negative to positive tone. The scores are averaged per UTC day, and the data updates once a day.
At the top sit today's numbers, below them the settings, then the plot. The sentiment uses the axis on the left, the price its own scale on the right.
2. Daily scores and the average
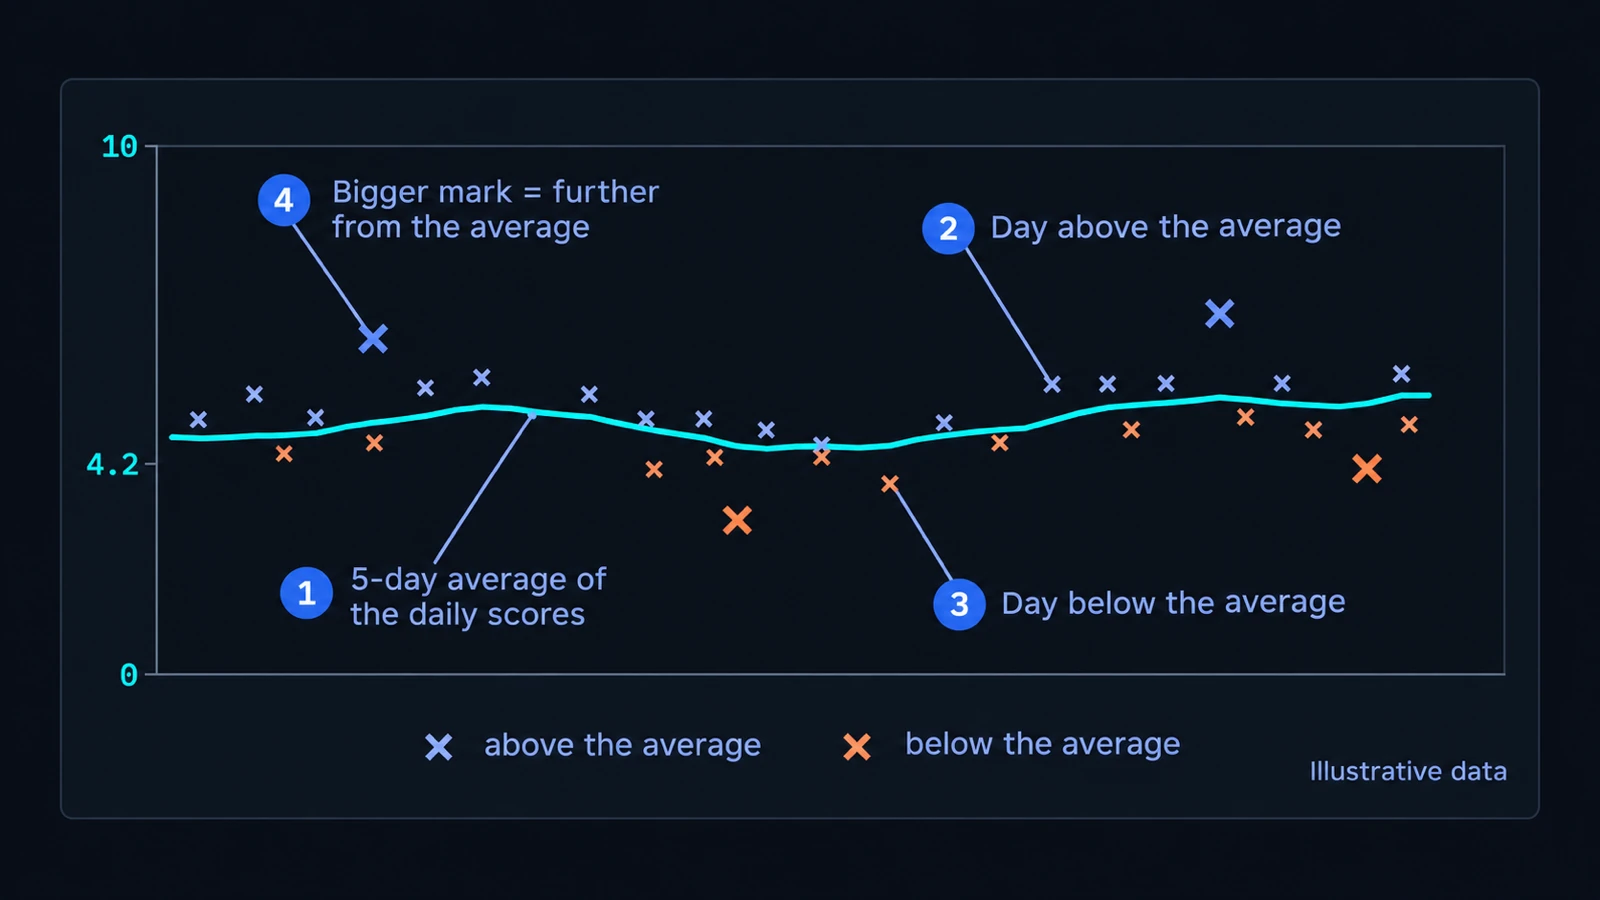
Each cross (×) is one day: the average score of that day's videos. Single days are noisy, so the cyan line smooths them with an exponential moving average (EMA), 5 days by default.
A cross is blue-violet when the day sits at or above the line and orange when it sits below. Larger, brighter crosses stand further from the line.
3. The usual range and the state
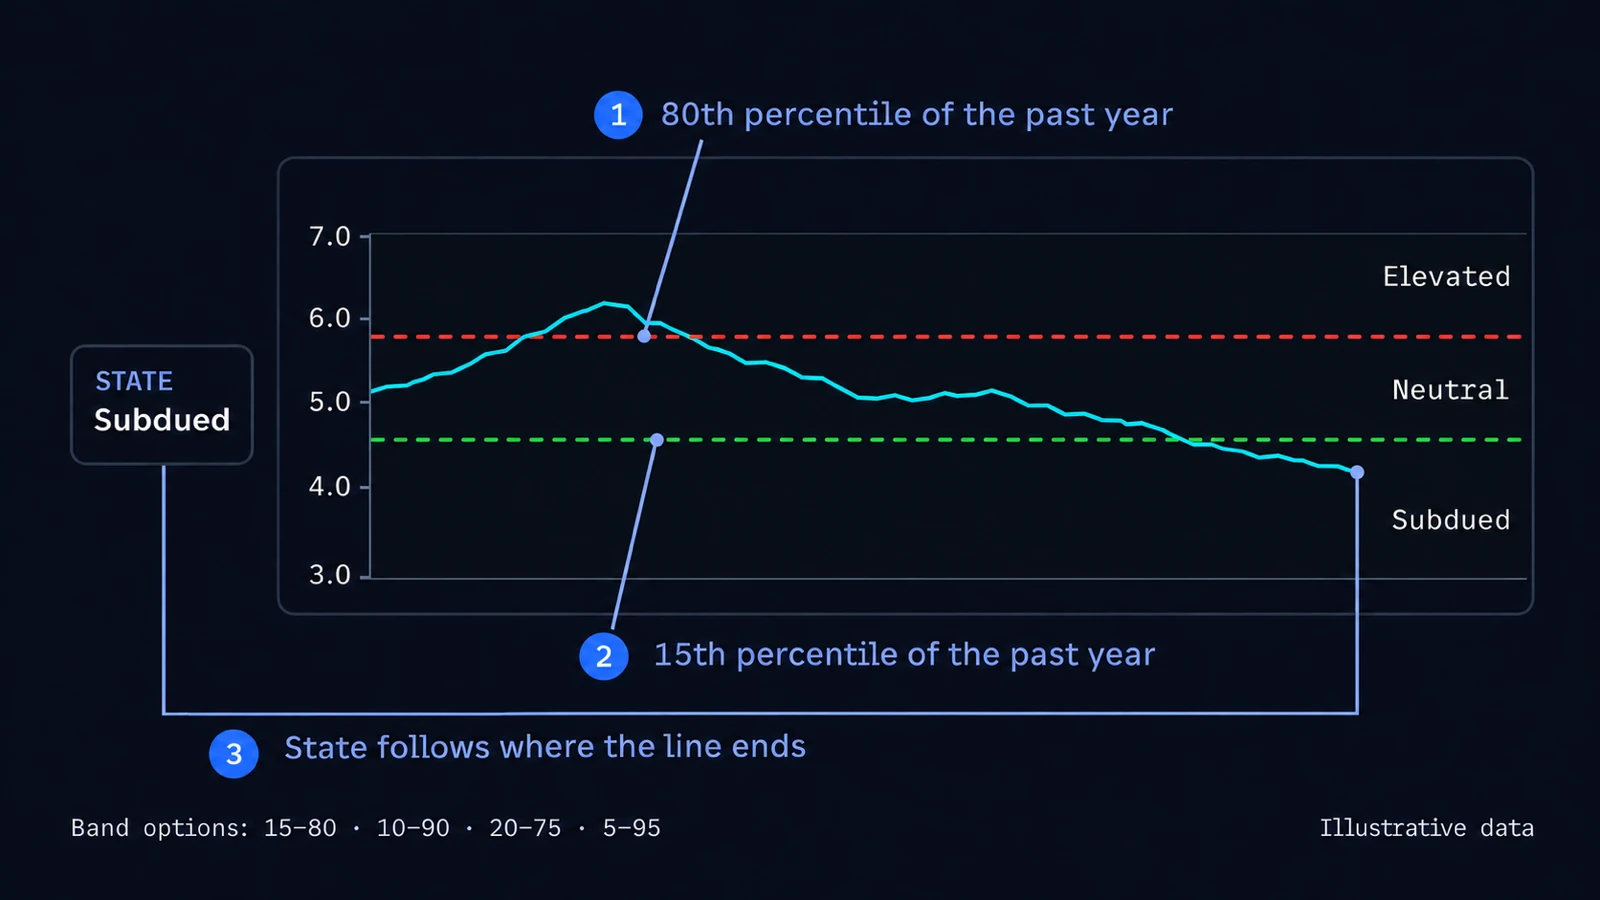
The two dashed lines mark the usual range of the past year. With the default band 15–80, the upper line is where the score stood at its 80th percentile over the past year, the lower line where it stood at its 15th percentile. Both are drawn flat at today's values.
The state follows where the line ends: Elevated above the upper line, Subdued below the lower one, Neutral in between. Because the range comes from the series' own past year, the same score can count as high in one year and as low in another.
Under Band you can pick 10–90, 20–75 or 5–95 instead, and the state follows your choice.
4. The numbers above the chart
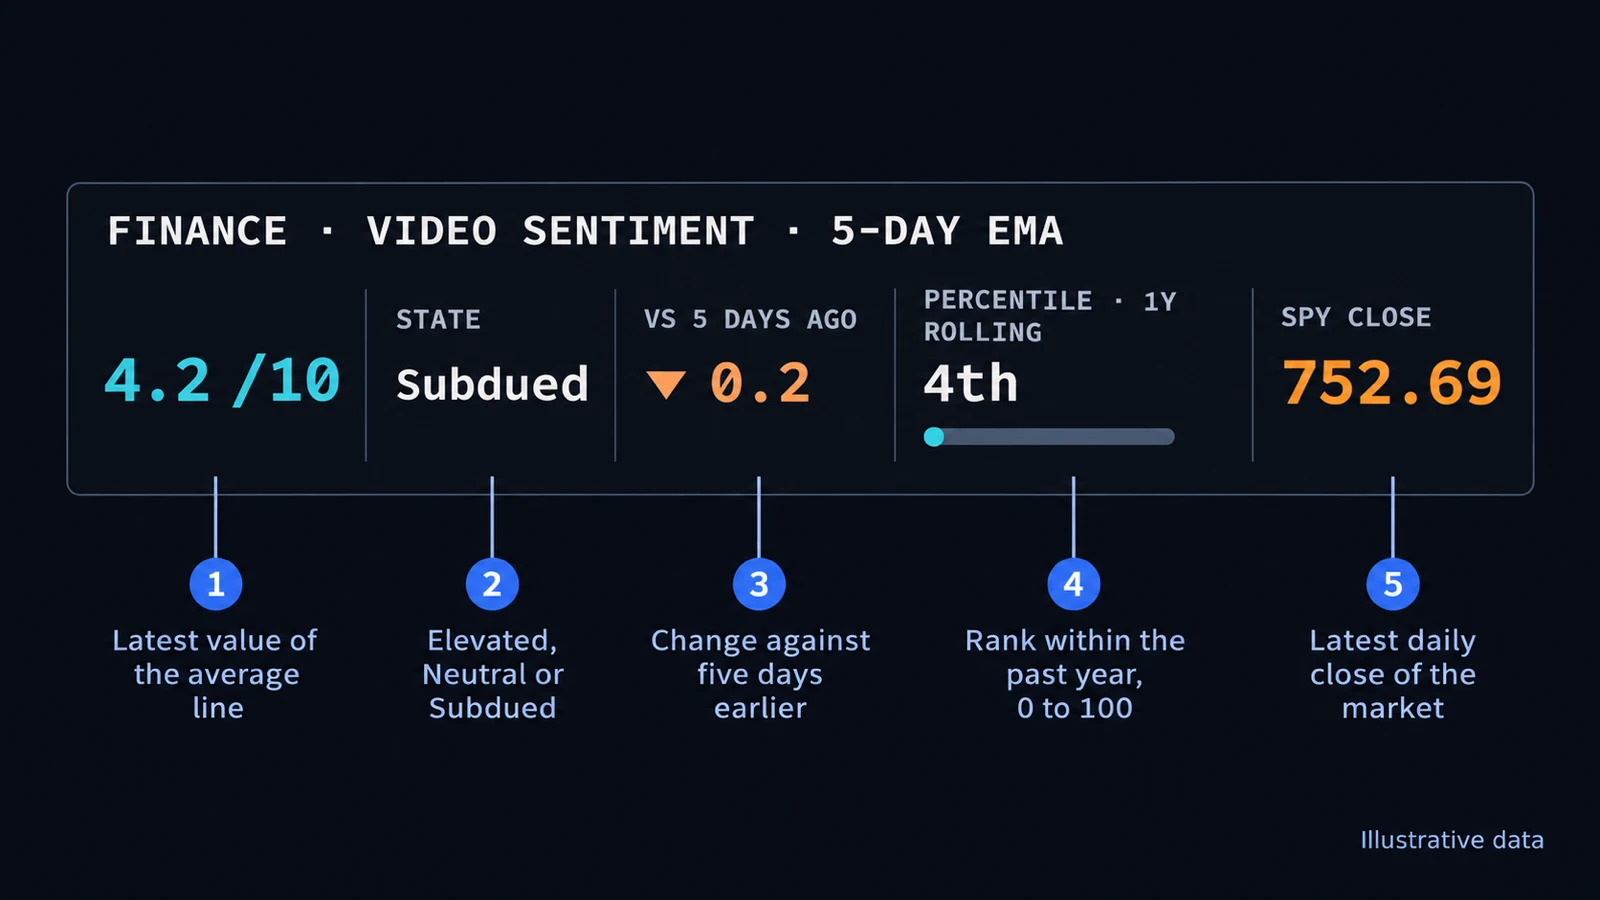
- Score: the latest value of the average line, out of 10.
- State: Elevated, Neutral or Subdued, as in the step above.
- vs 5 days ago: the change of the score against five days earlier. These are calendar days, or trading days when weekends are merged.
- Percentile · 1Y rolling: how today's score ranks within the past year, from 0 to 100. Low numbers mean the score sits near the bottom of its past year.
- Close: the market's latest daily close.
5. Chart settings
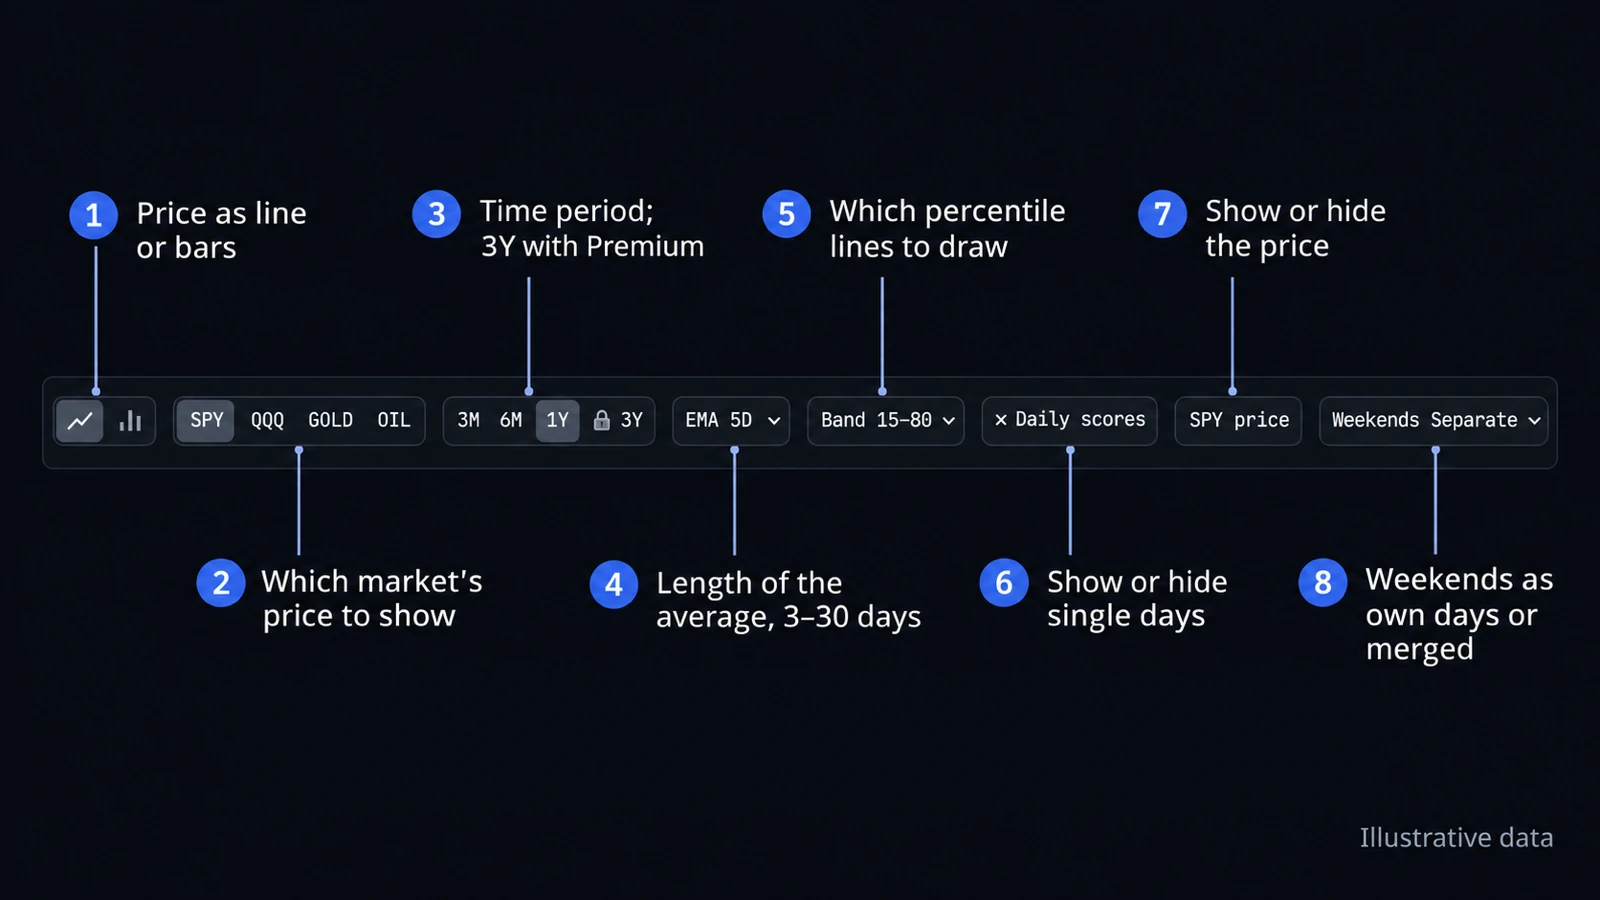
- Line or bars: the price as a line of daily closes, or as bars with each day's open, high, low and close.
- Market: SPY, QQQ, GOLD or OIL, the price shown next to the sentiment.
- Time period: 3 months to 3 years. Free shows one year of history; 3 years come with Premium.
- EMA: the length of the average line, 3, 5, 10, 20 or 30 days, or off.
- Band: which percentile lines to draw, 15–80, 10–90, 20–75 or 5–95, or off.
- Daily scores and price: show or hide the crosses and the price line.
- Weekends and holidays: Separate keeps them as their own days, and the price line just bridges them. Merged counts them toward the next trading day.
- Share: copy a link to the chart with your current settings.
6. How to read it
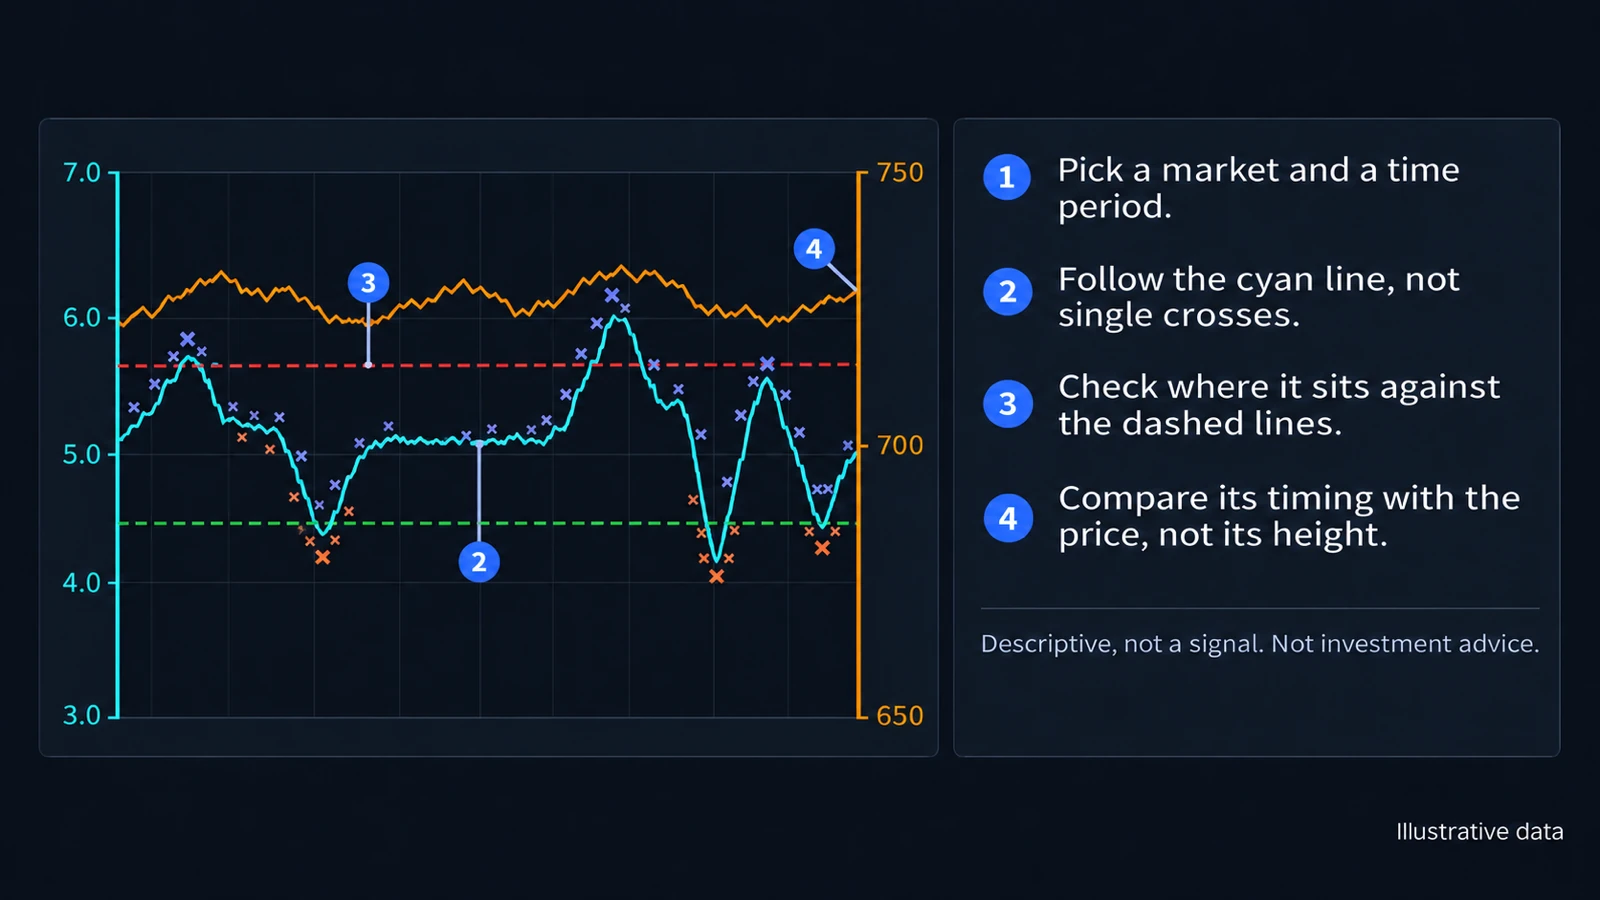
- Pick a market and a time period.
- Follow the cyan line, not single crosses.
- Check where it sits against the dashed lines.
- Compare its timing with the price, not its height.
Sentiment and price use separate scales, so where the two lines cross or how far apart they sit means nothing. Compare when each one rises and falls.
Crypto
The Crypto sentiment chart works the same way, with crypto video commentary and Bitcoin (BTC), Ethereum (ETH), Solana (SOL) or Dogecoin (DOGE) as the market. It has no weekend setting: crypto trades every day, so every day has its own price.
Descriptive, not a signal.
The chart describes the mood of market commentary next to the market. It does not predict prices and does not tell you what to buy or sell. Sentiment and price can line up; that is no proof of cause and no forecast. Each day's value uses only commentary published up to that day. Nothing here is investment advice. Read the full disclaimer.