
1. The chart at a glance
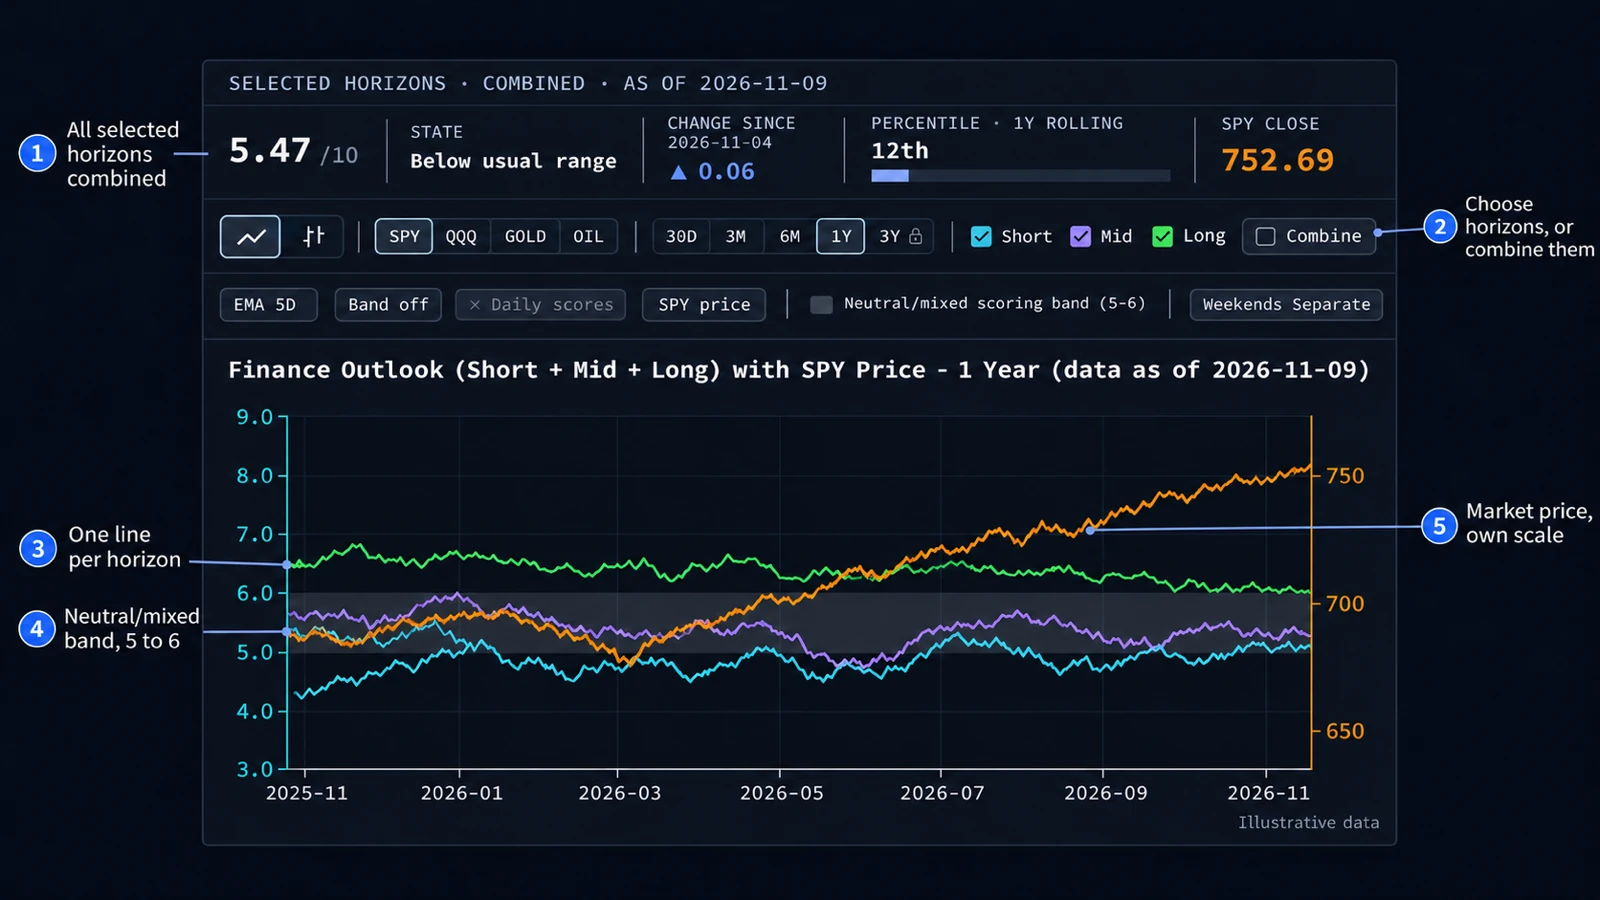
The chart sets two things side by side: what finance video commentary expects the market to do next, and the price of a market. Every video gets an outlook score from 1 (bearish) to 10 (bullish). The scores are averaged per day, the lines smooth them with a 5-day exponential moving average (EMA), and the data updates once a day.
At the top sit the numbers, below them the settings, then the plot. The outlook uses the axis on the left, the price its own scale on the right.
2. Three horizons
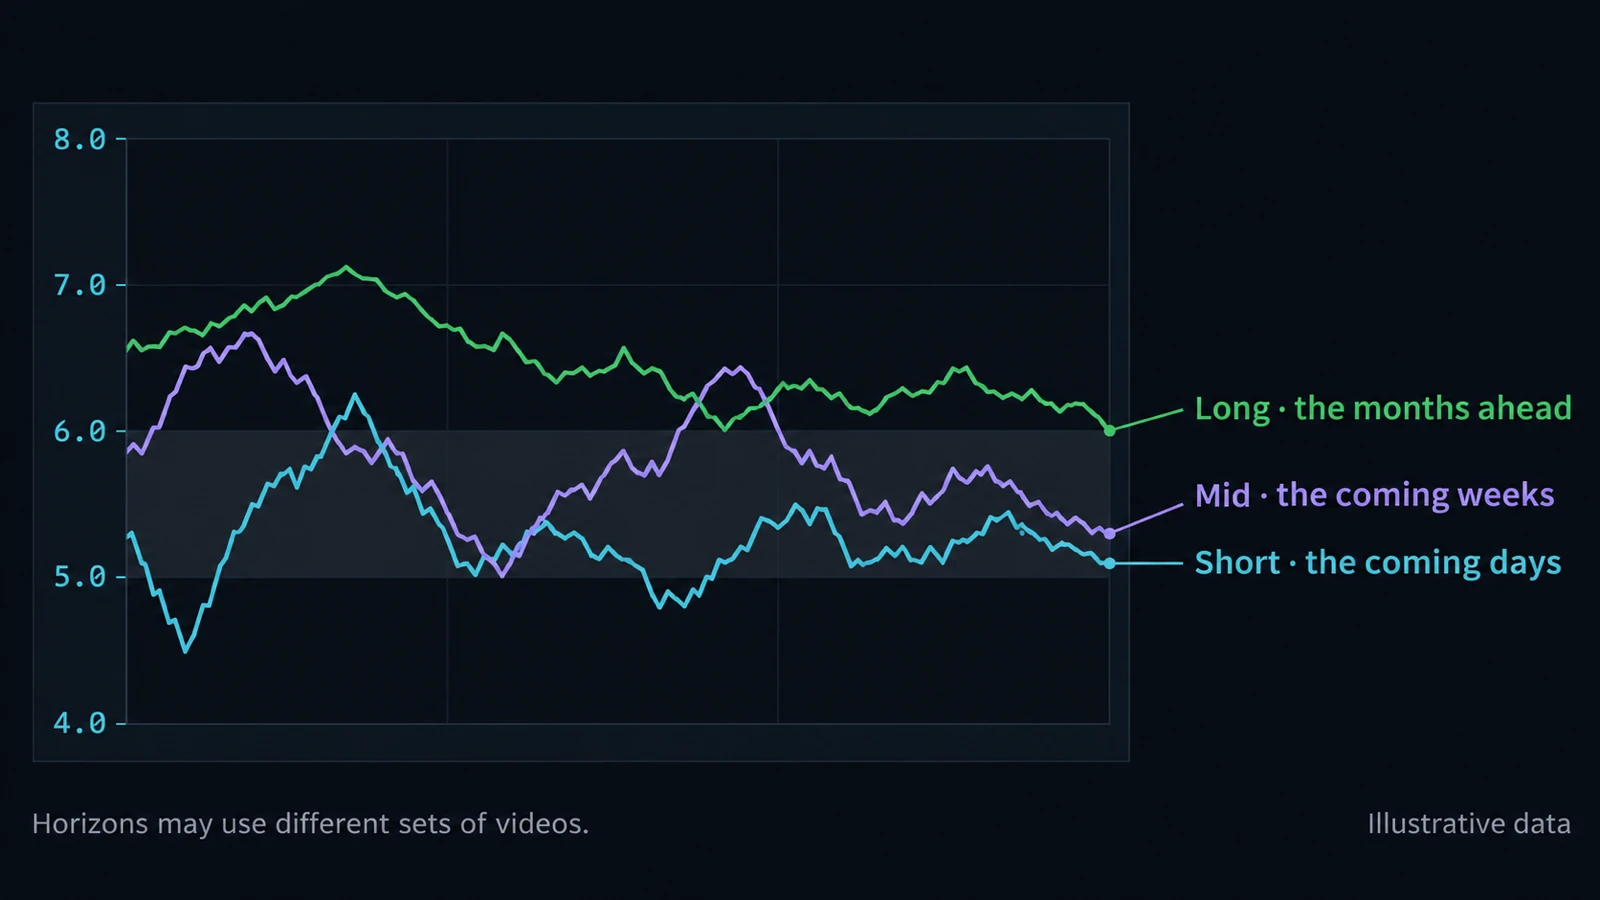
- Short (cyan): the coming days.
- Mid (violet): the coming weeks.
- Long (green): the months ahead.
Not every video speaks about every horizon, so the horizons can rest on different videos. The checkboxes above the chart choose which horizons are drawn; at least one stays on.
3. The scale and the neutral band
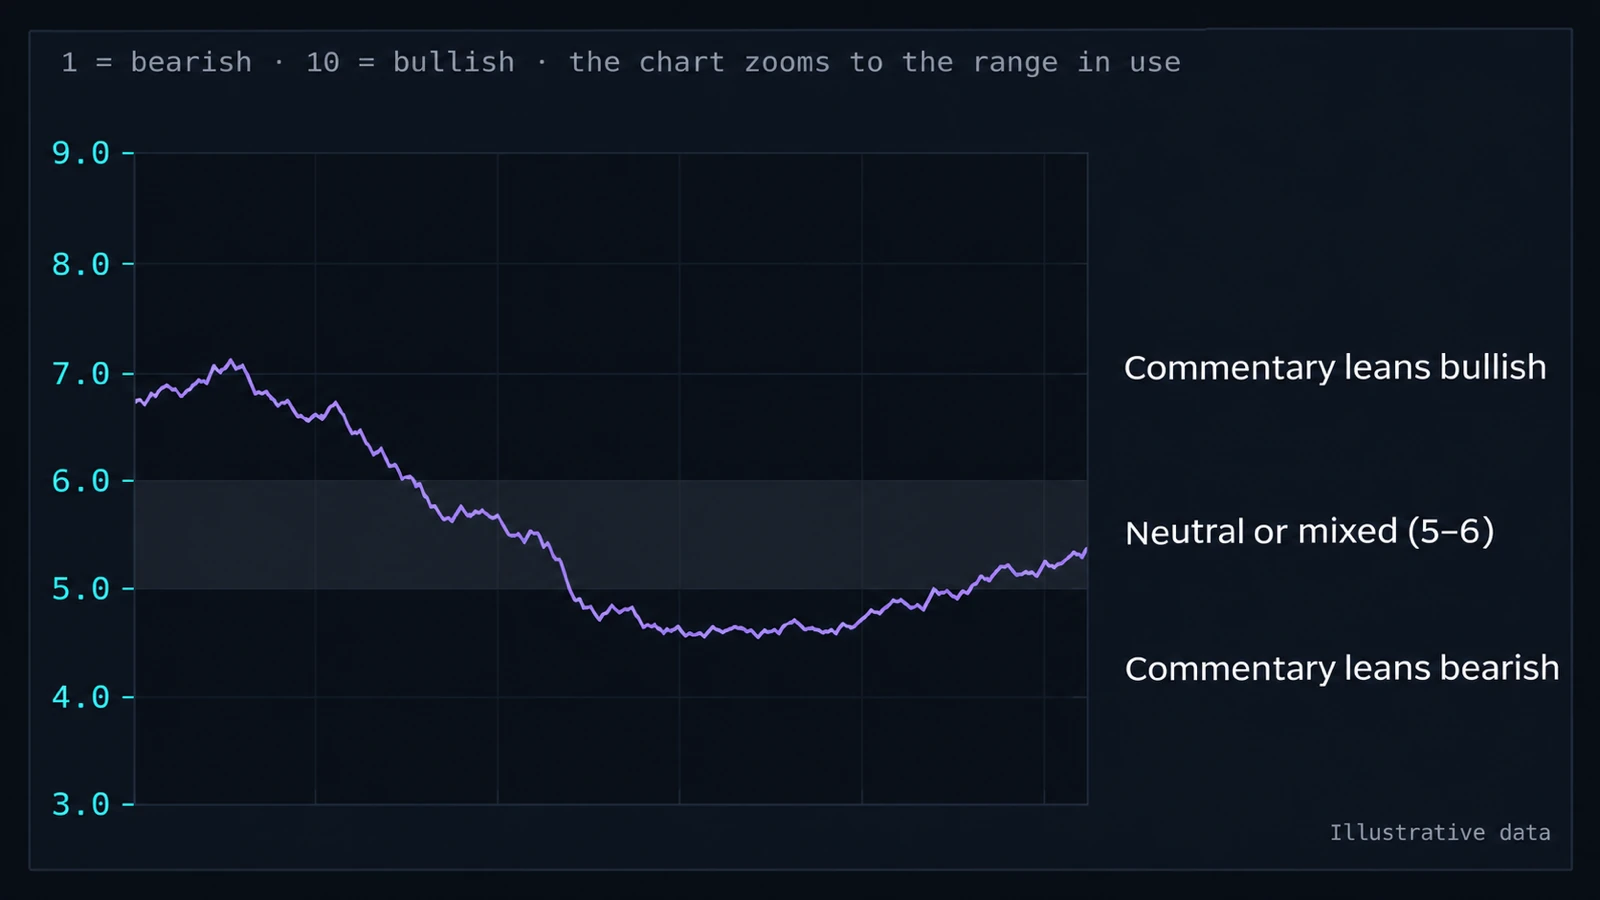
The scale runs from 1 (bearish) to 10 (bullish). The grey band from 5–6 is the neutral band: a line inside it stands for views that are neutral or mixed. Above the band commentary leans bullish, below it bearish.
The band is drawn whenever the chart shows horizon lines, one or several. The left axis zooms to the range the lines use, so it rarely shows the full 1 to 10.
4. The combined line and the state
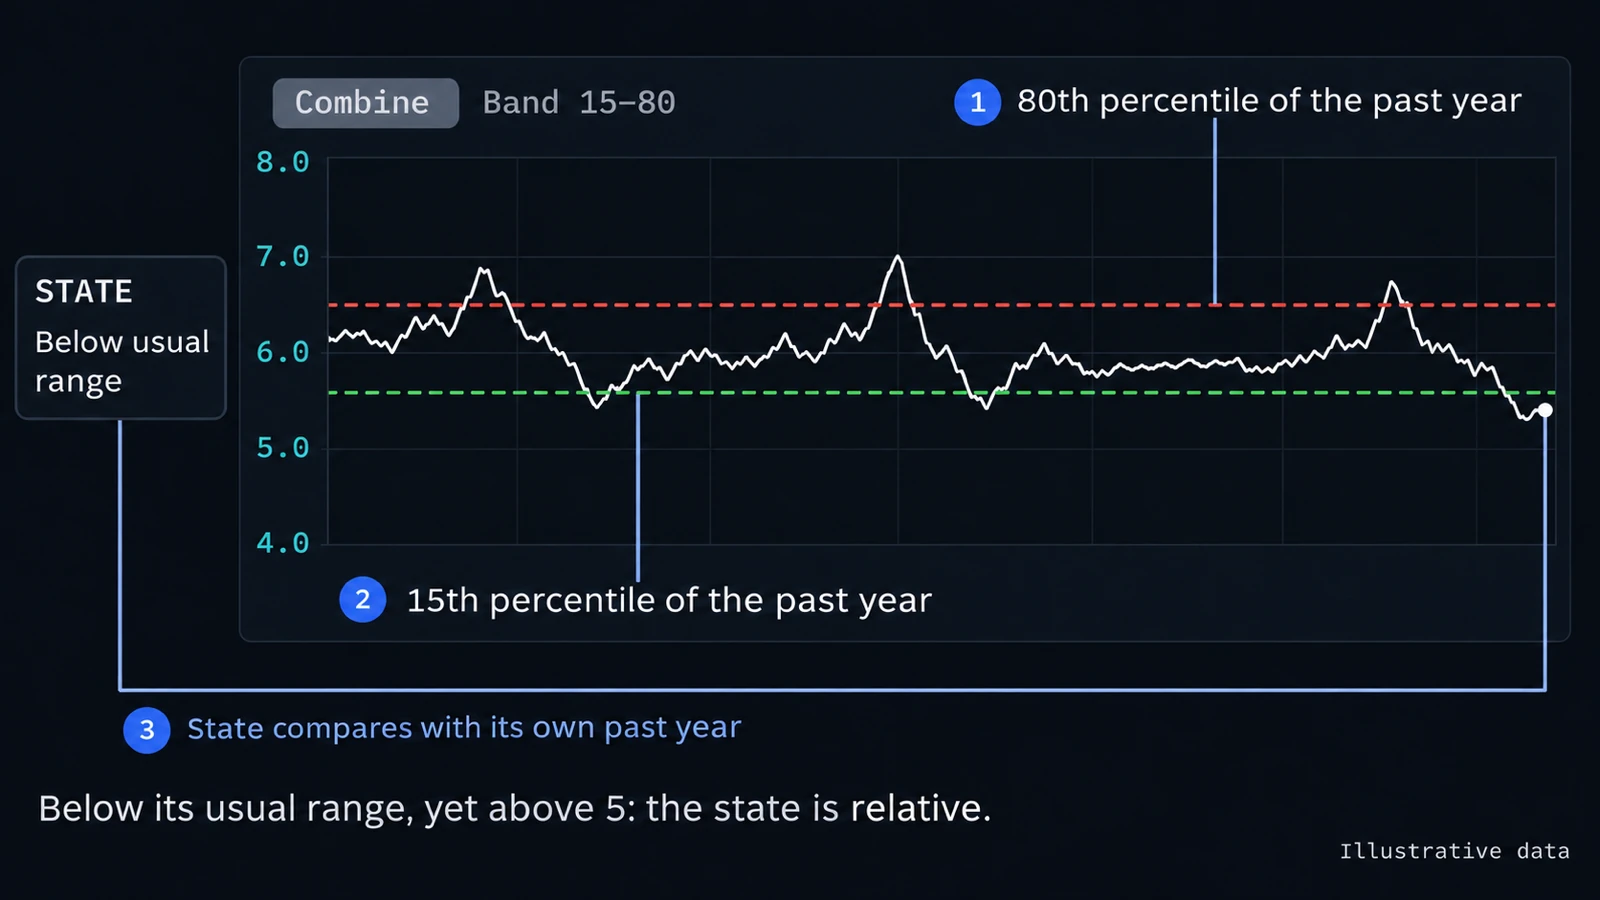
Combine draws one line over the selected horizons instead of one per horizon. For this line you can turn on the dashed percentile lines under Band: with the default 15–80, the upper line is where the combined line stood at its 80th percentile over the past year, the lower line where it stood at its 15th percentile. Turning the band on switches to Combine. The grey band is not drawn for the combined line, because it describes single videos, not a line combined over many.
The state is Above usual range, Within usual range or Below usual range, measured against these percentile lines. It is relative to the line's own past year, not to the 1–10 scale: a line can sit below its usual range and still score above 5, or above its usual range and still score below 5.
5. The numbers above the chart
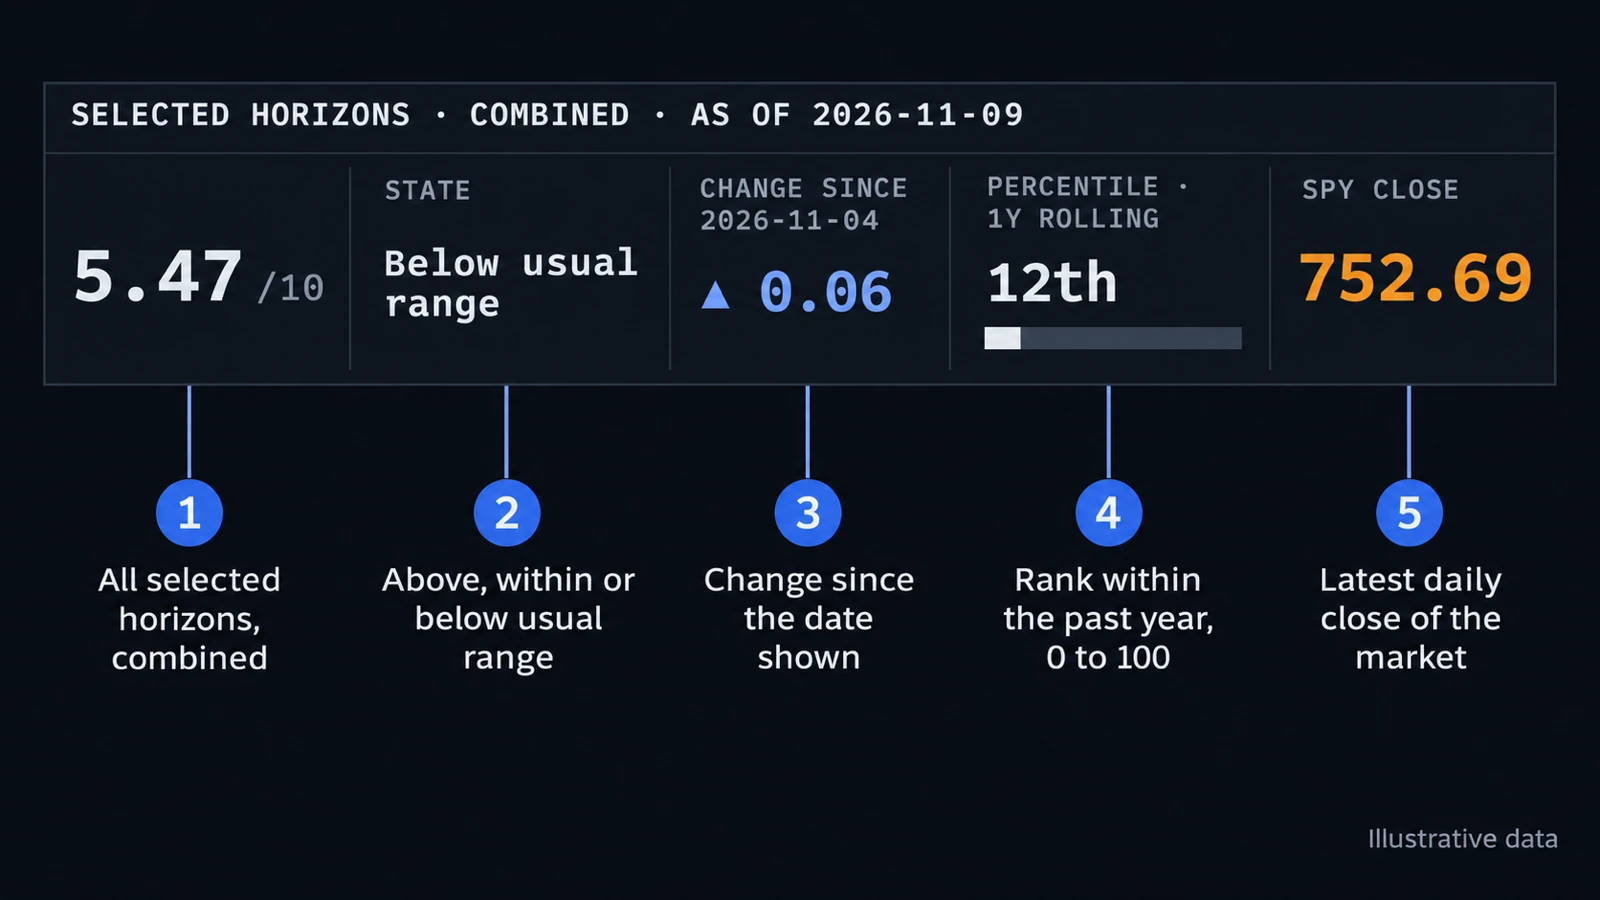
The numbers always describe the selected horizons combined, also when the plot draws a line per horizon.
- Score: the combined value of the selected horizons on the latest day, out of 10.
- State: Above, Within or Below usual range, as in the step above.
- Change since: the change of the combined value since the date shown.
- Percentile · 1Y rolling: how today's combined value ranks within the past year, from 0 to 100.
- Close: the market's latest daily close.
6. The last seven days
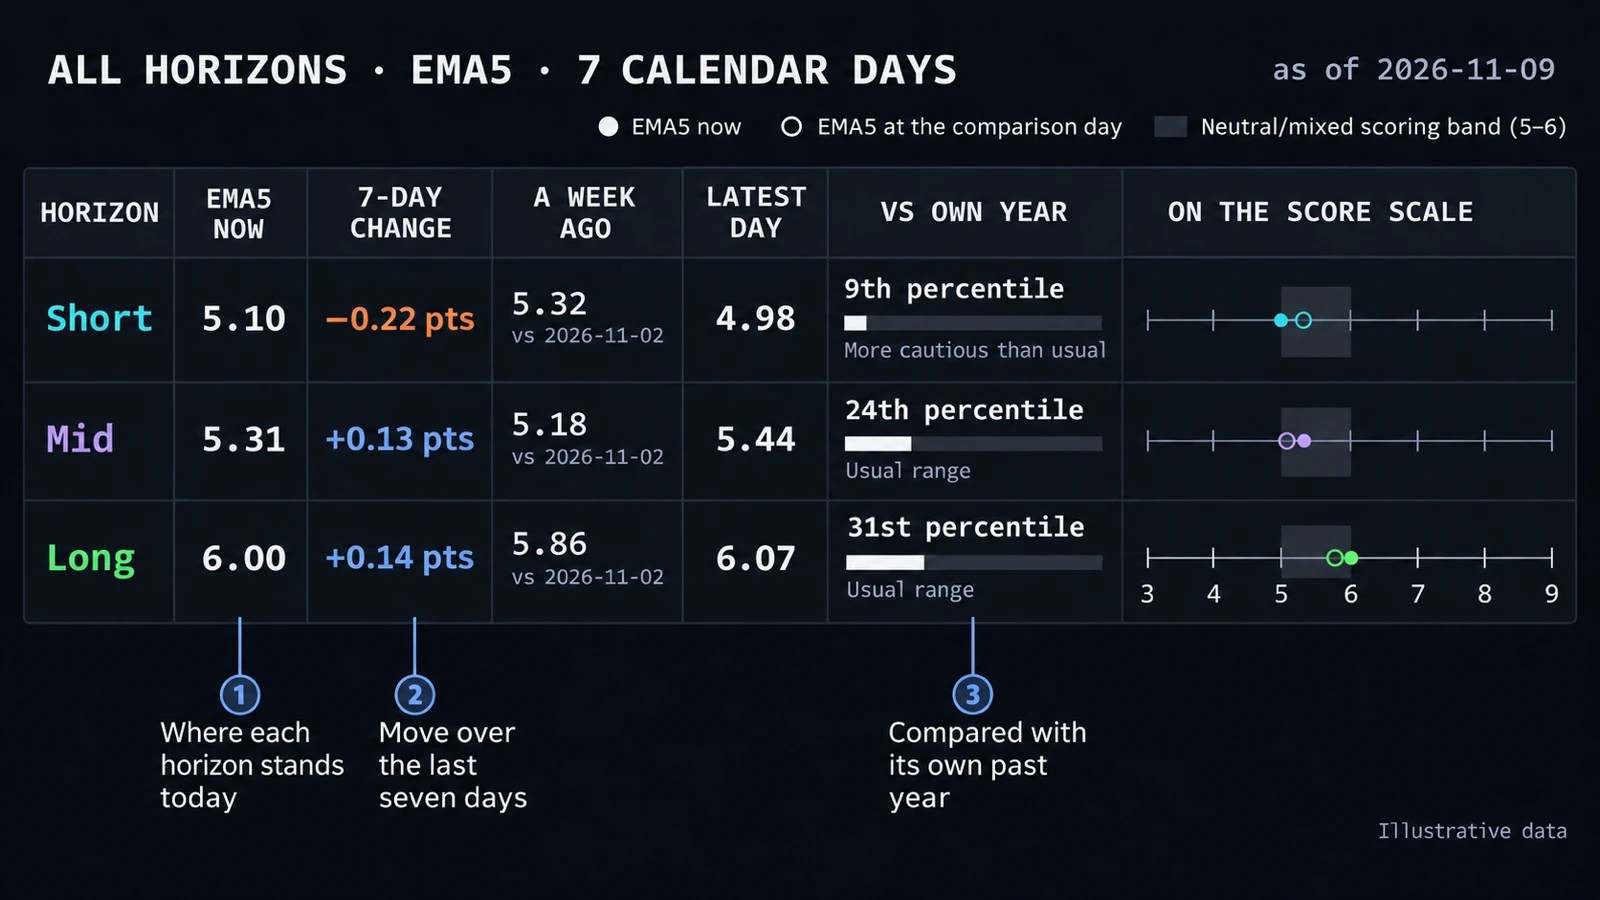
The table always shows all three horizons on the 5-day average, over seven calendar days, whatever the chart above shows.
- EMA5 now and a week ago: where each horizon stands today and seven days earlier. 7-day change is the difference.
- Latest day: the last single day's score.
- Vs own year: how today's value ranks within the horizon's past year, with More bullish than usual, Usual range or More cautious than usual.
- On the score scale: a dot for now and a ring for a week ago, next to the grey 5–6 band.
7. How to read it
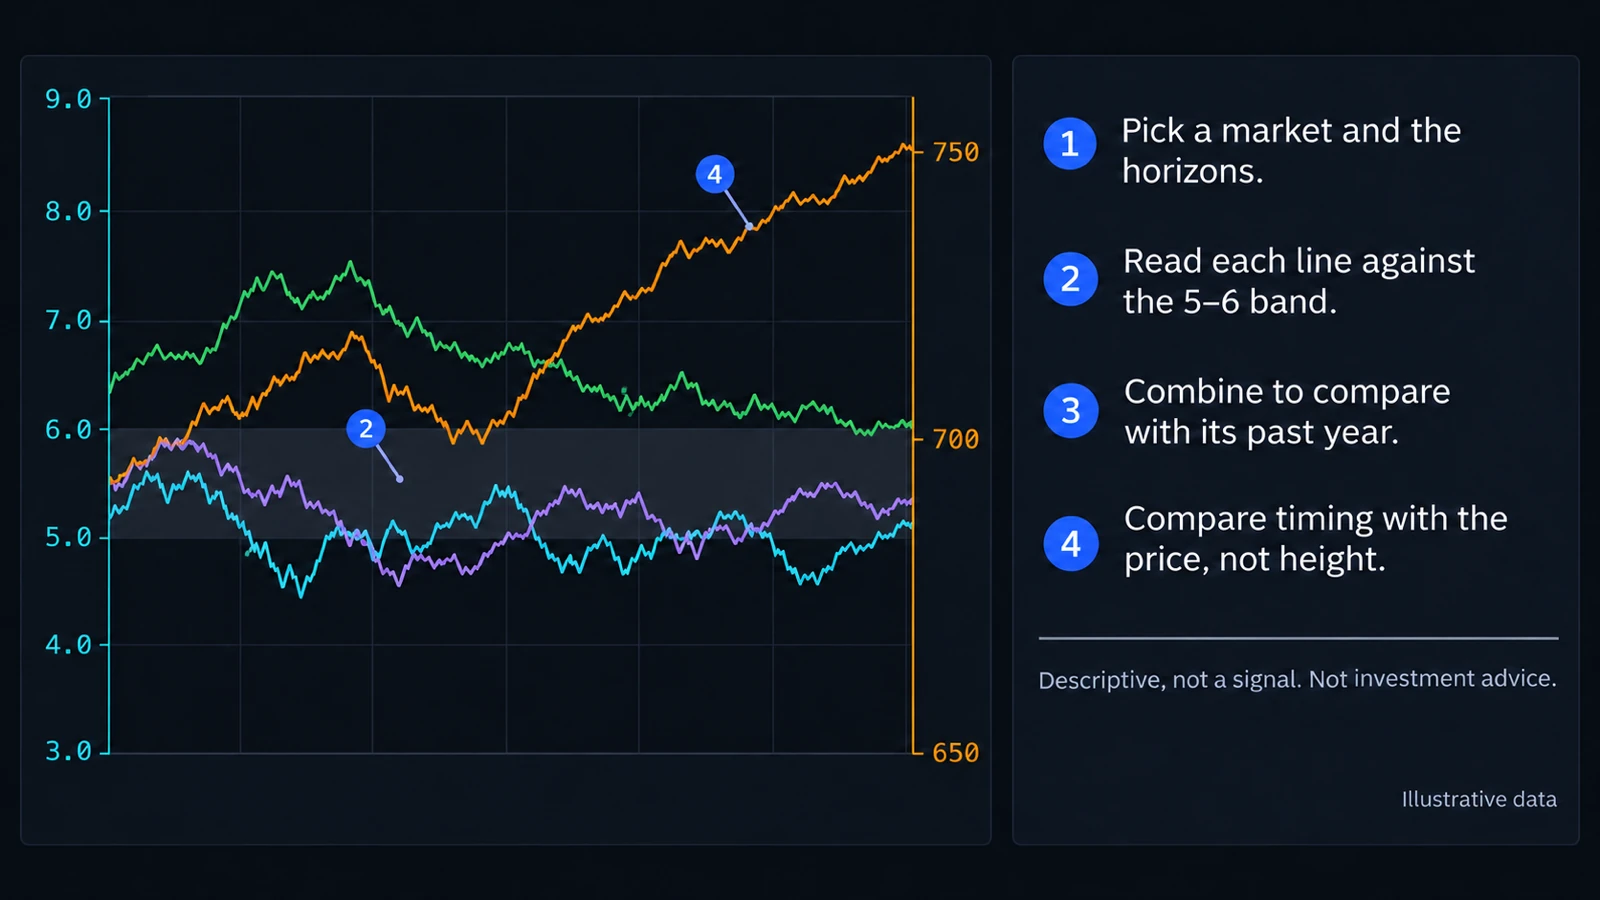
- Pick a market and the horizons.
- Read each line against the 5–6 band.
- Combine to compare with its past year.
- Compare timing with the price, not height.
Outlook and price use separate scales, so where the lines cross or how far apart they sit means nothing. Compare when each one rises and falls.
Crypto
The Crypto outlook chart works the same way, with crypto video commentary and Bitcoin (BTC), Ethereum (ETH), Solana (SOL) or Dogecoin (DOGE) as the market. It has no weekend setting: crypto trades every day, so every day has its own price.
Descriptive, not a signal.
The chart describes what market commentary expects, next to the market. It is no forecast of prices and does not tell you what to buy or sell. Outlook and price can line up; that is no proof of cause. Each day's value uses only commentary published up to that day. Nothing here is investment advice. Read the full disclaimer.