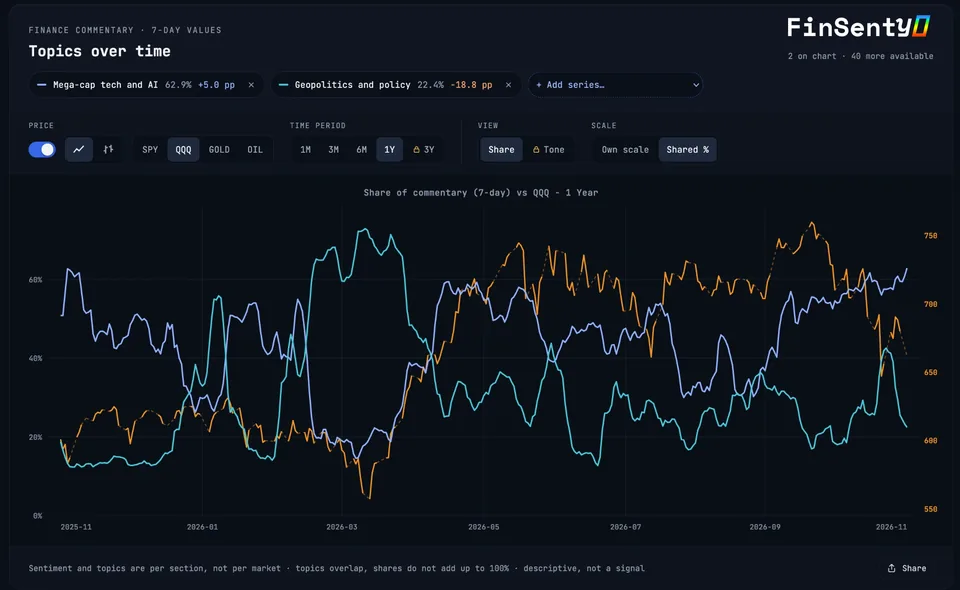
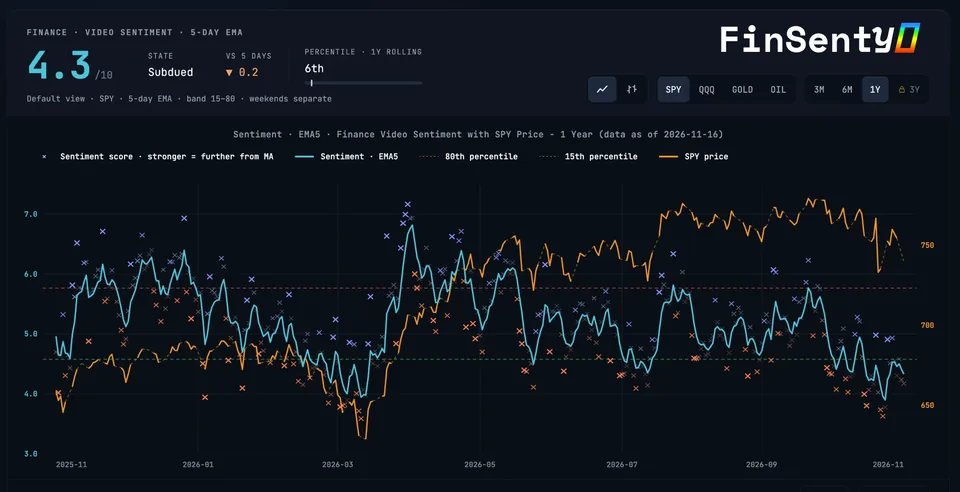
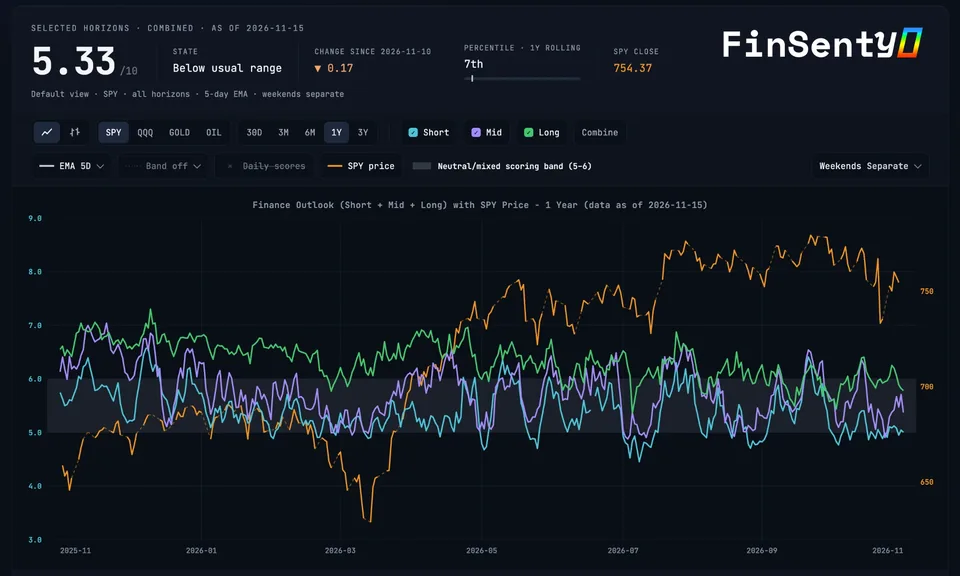
The finance media mood is near a one-year low. Channel by channel, it looks different.
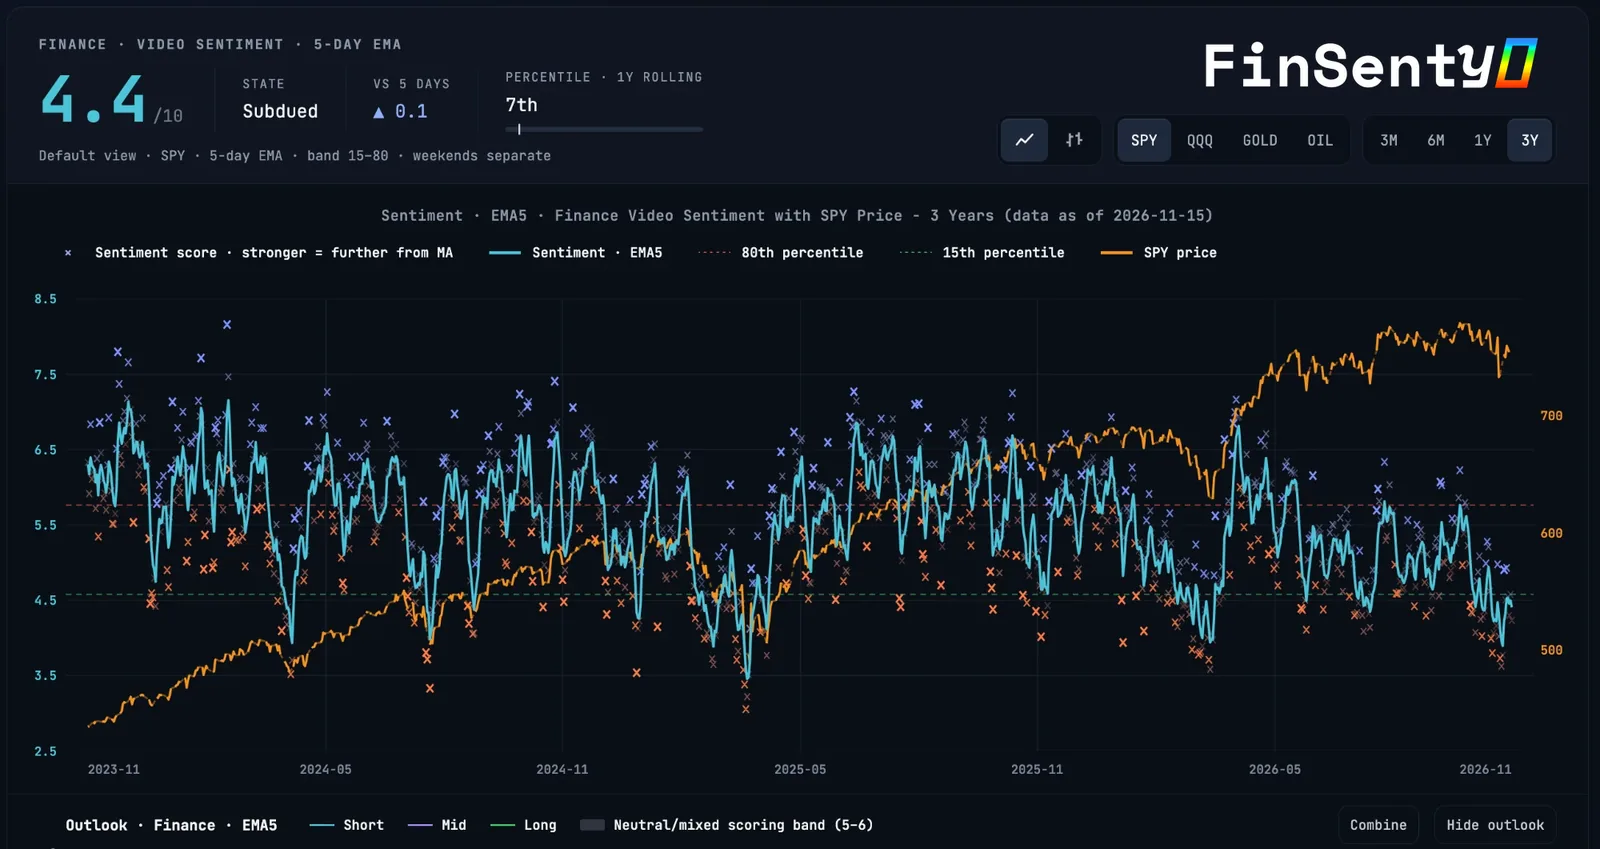
Finance media sentiment stands at 4.4 out of 10 on 15 November 2026, in the bottom 7% of the past year. Measured channel by channel against each one's own usual tone, the gloom is broad but no longer extreme.
- By
- FinSenty Editorial
- Published
- Data as of
- (UTC)
The overall mood
Finance media sentiment, as a five-day average on a scale of 1 to 10, stands at 4.4 on 15 November 2026. That is up 0.1 over five days, and in the bottom 7% of the past year. The low of the past year is 3.9, reached on 28 March and again on 8 November 2026.
A second way to look at it
The sentiment score averages all videos. A channel that publishes many videos therefore weighs more than one that publishes few. And some channels are always more upbeat or more gloomy than others.
So we also compare each channel with its own usual tone, its long-run average. Every channel counts once and is judged against its own habits. Two measures come out of this, both as five-day averages:
| Measure | 15 November 2026 | A week earlier | Low of the past year |
|---|---|---|---|
| Share of channels above their own average | 17% | 12% on 8 November | 5% on 28 March |
| Average distance from their own usual tone | 14% below, within the normal range | 27% below on 7 November | 29% below on 28 March |
What the difference says
The pessimism is broad: more than four in five channels sit below their own norm. But it is not extreme. On average, channels sit 14% below their usual tone, which is inside the normal range of the past year. A week earlier the gap was 27%, close to the low of the past year.
In other words, around 7 November many voices broke sharply from their usual tone. Since then they have moved much closer to it, while the overall level of the mood has stayed low.
Sources and data
FinSenty finance media sentiment (1 to 10), five-day average of daily scores, UTC days, weekends shown separately. Rank against the daily values of the past year.
Channel measures: each channel's daily score compared with its own average of all earlier days. Share above average: percent of channels above their own average. Distance: average percent distance from their own average. Both as five-day averages. The normal range is the middle band of the past year's values.
Data through 15 November 2026.
This post reflects media commentary up to its data day, 15 Nov 2026, and is not investment advice. Today's values are on the live Finance overview.